
For app builders
Show a total at the top of each Kanban column
Show a sum, average, lowest or highest figure for each column, as a number, a currency or a percentage.
The screenshots show the English interface. The buttons are in the same places, and most are labelled in your language.
A board column can show one figure about the records in it, for example the total value of the deals in each stage. The figure covers every record in the column, not only the cards loaded on screen, and it follows your filters.
- 1
Open the app in the board view and choose View in the toolbar.
- 2
In the board settings, set Column header field to a number, amount, progress or calculated field.
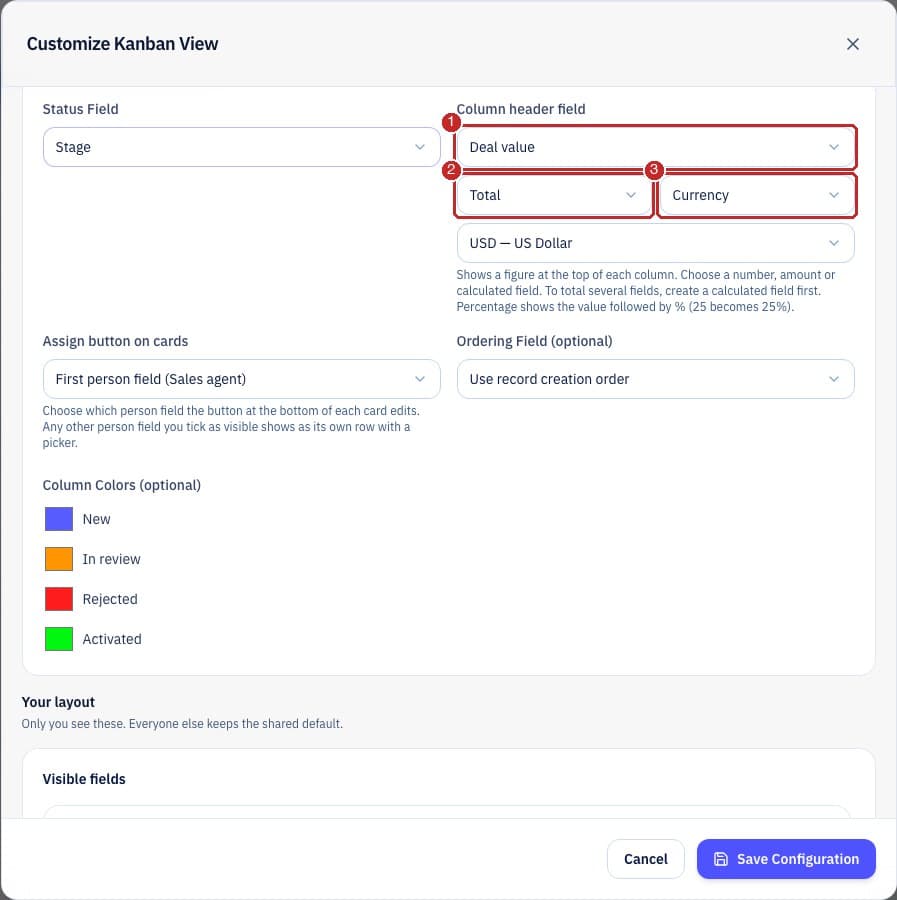
- 1Column header field: nothing is chosen by default. To total several fields, create a calculated field first and choose that.
- 2Show: the total, average, lowest or highest value.
- 3Display as: a plain number, a currency with its sign, or a percentage. For a currency you also choose a code, such as ZAR or USD.
- 3
Save with Save Configuration. These settings are part of the shared setup, so everyone sees the same figures.

- 1The figure sits under the column name and takes the column colour. You change a column colour in the same settings window.
Percentages and currenciesA percentage shows the value followed by %, so 25 shows as 25%. A calculated ratio such as 0.25 shows as 0.25%, so multiply by 100 in the formula. An amount field that holds more than one currency in a column shows Mixed currencies for that column.
Who can do thisPeople who can edit the app can change the shared board setup.
Related guides
Need more help?
Our team is happy to help.